Server Monitoring with Ptah.sh
Resource monitoring is a critical aspect of maintaining a robust and reliable infrastructure. Ptah.sh provides comprehensive monitoring capabilities to ensure optimal operation and quick resolution of issues.
Key Metrics Monitored by Ptah.sh
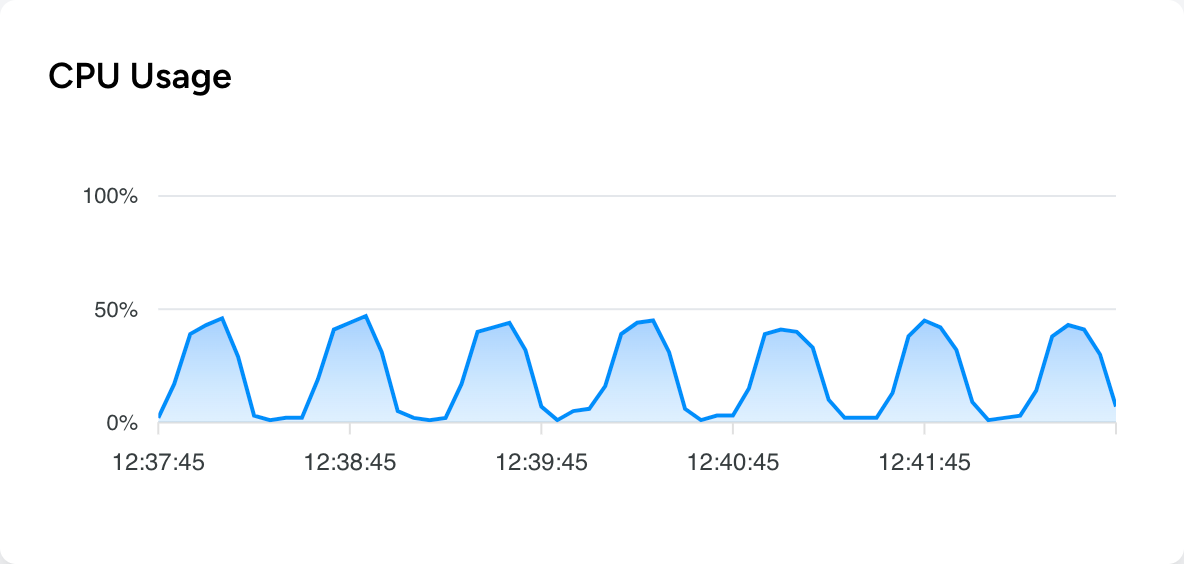
1. CPU Usage (%)
Track processor utilization to prevent bottlenecks and ensure smooth operation.
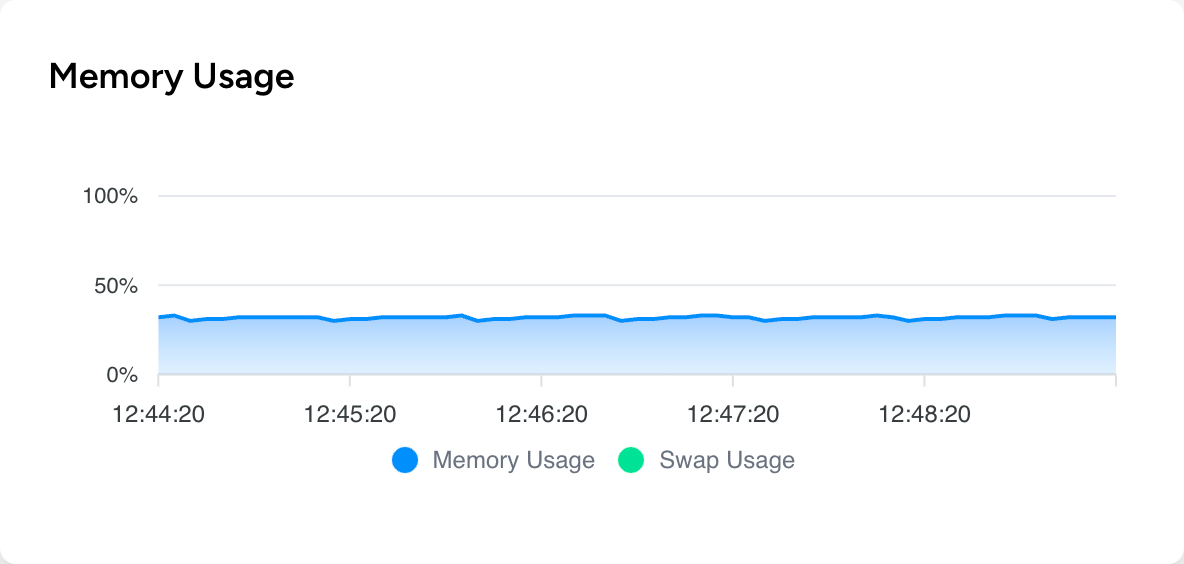
2. Memory Usage and Swap (%)
Monitor RAM consumption to avoid slowdowns and optimize application performance. Keep track of swap memory usage to identify potential memory constraints.
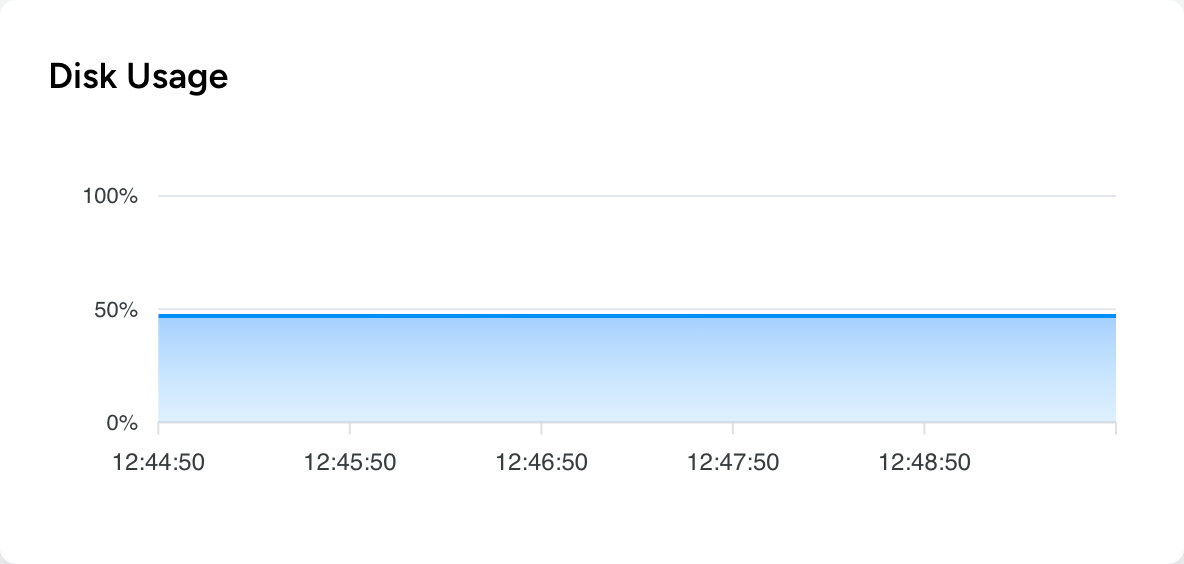
3. Disk Usage (of ”/”)
Monitor the root partition’s storage capacity to prevent disk space issues.
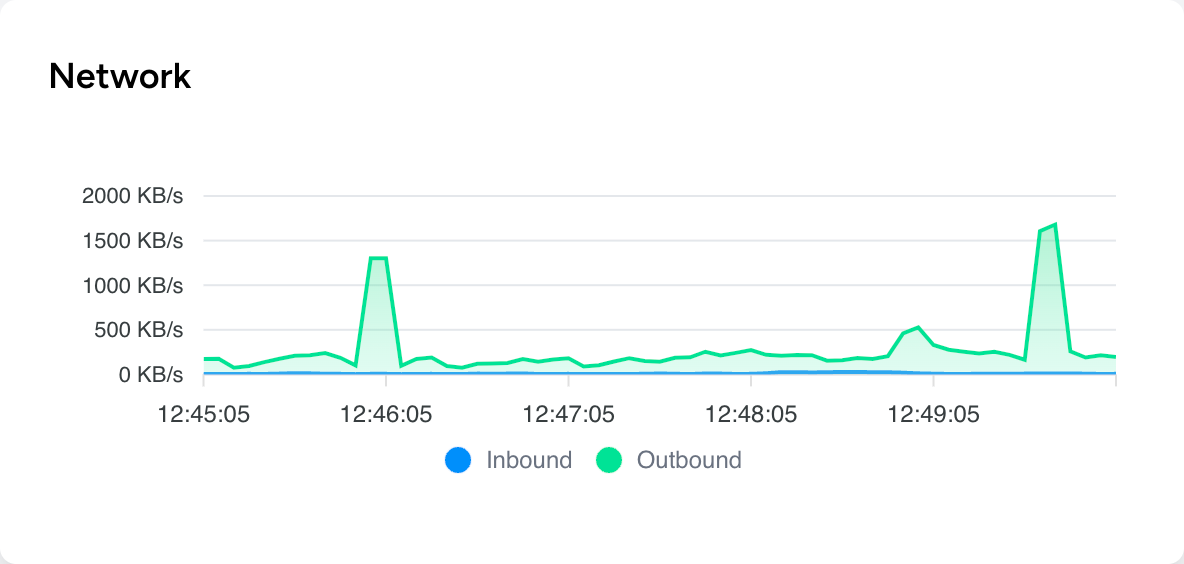
4. Network Traffic (IO KB/s)
Measure bandwidth usage for all networks to identify anomalies and ensure optimal performance.
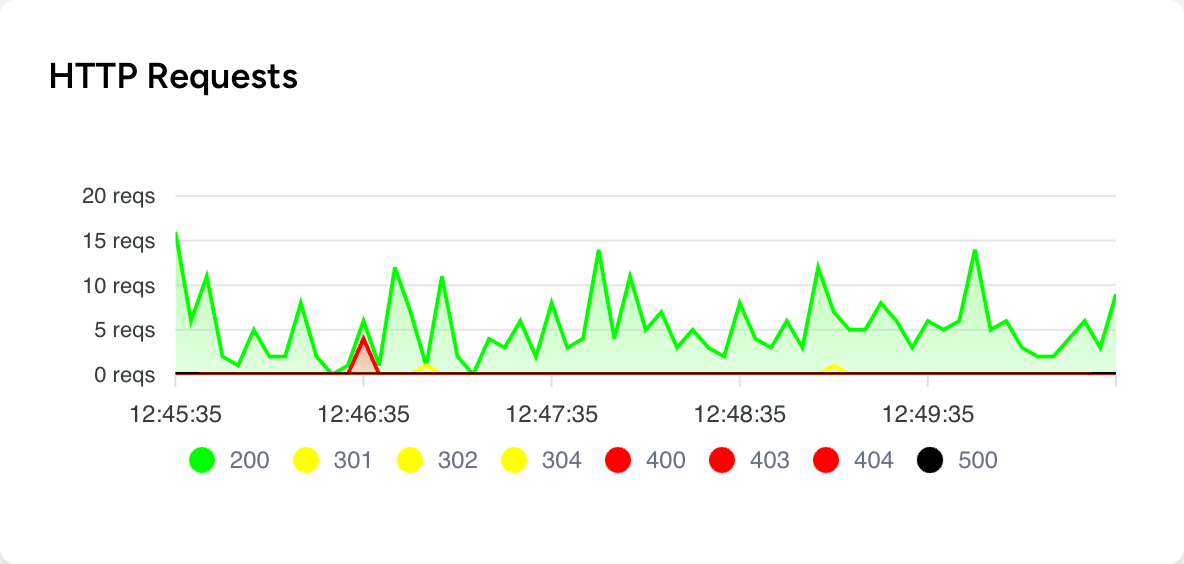
5. HTTP Requests by Status Code
Track the number of HTTP requests handled by Caddy, categorized by their HTTP status codes. This provides insights into server load, usage patterns, and potential issues.
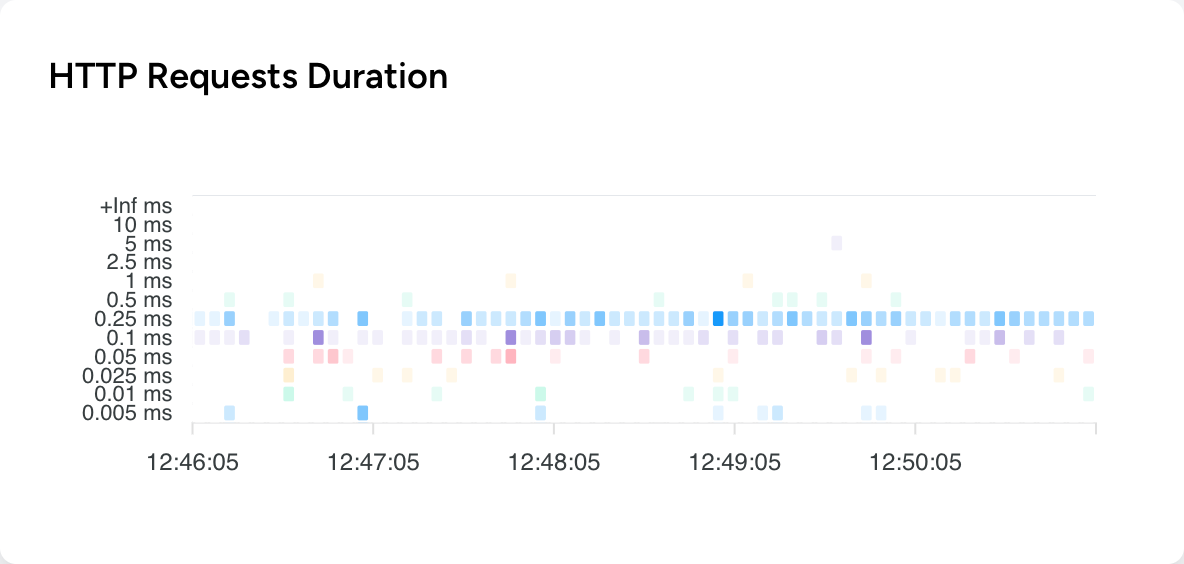
6. HTTP Requests Duration
Visualize the distribution of HTTP request durations to identify performance issues and optimize response times.
Benefits of Server Monitoring with Ptah.sh
- Proactive Problem Detection: Identify and address issues before they impact users
- Performance Optimization: Gain insights to improve server efficiency
- Capacity Planning: Make informed decisions about scaling resources
- Security: Detect unusual activities that may indicate security threats
- Real-time Visibility: Get instant insights into your server’s health and performance
Best Practices for Server Monitoring with Ptah.sh
- Regular Review: Periodically analyze monitoring data to identify trends and potential improvements
- Correlate Metrics: Look for relationships between different metrics to gain deeper insights
- Update Regularly: Keep your Ptah.sh installation up to date to benefit from the latest features and improvements
Conclusion
Effective server monitoring with Ptah.sh is essential for maintaining a healthy IT infrastructure. By leveraging the comprehensive metrics and visualizations provided by Ptah.sh, you can ensure high availability, optimal performance, and rapid issue resolution for your servers.